
Monitoring
Requests, status codes, and latency for the running chat
Monitoring, in the Chat menu, charts the chat's running deployment. It uses the same charts as MCP monitoring, so reading one teaches you the other.
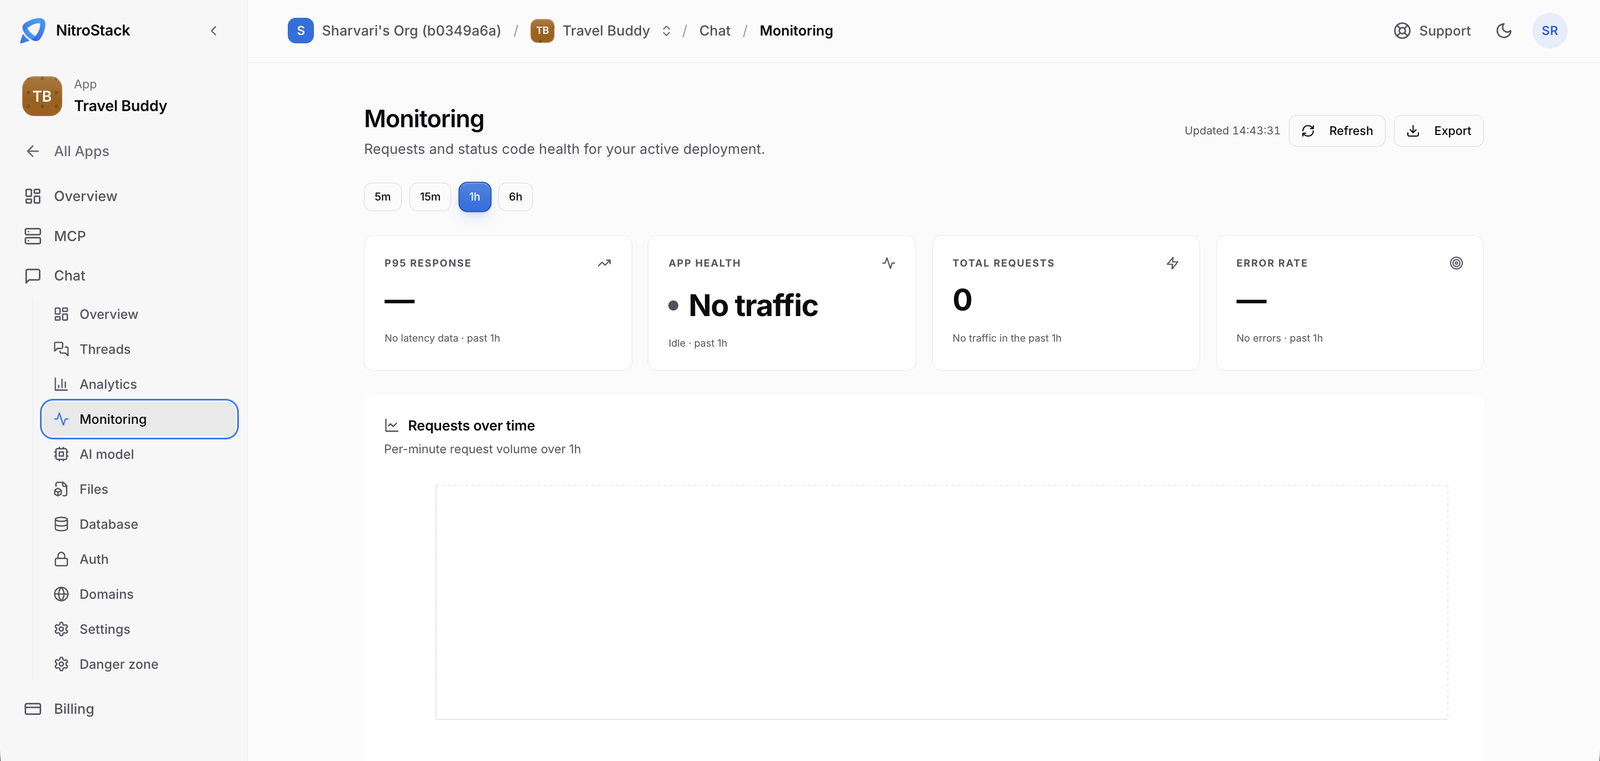
Pick a time range at the top. The summary cards show the 95th-percentile response time, app health, total requests, and error rate. Below them:
- Requests over time charts the chat's traffic.
- Status code distribution breaks requests down by response class.
- Latency charts response times.
Refresh reloads the charts, and Export downloads them.
The four numbers on the chat's General page are the same summary for the past hour, and Performance metrics there opens this page.
If the chat has never been deployed, the page says No active deployment and links back to the chat overview. There's no data to chart until the chat is running.
To see why a particular request was slow or failed, open its conversation on Threads. Each assistant reply shows how long it took, and each tool call shows your server's response.