
AppsMCP
Monitoring
Watch requests, status codes, and latency for your live deployment
Monitoring charts requests and status codes for your active deployment. Pick a time range at the top, from the last few minutes to the last day.
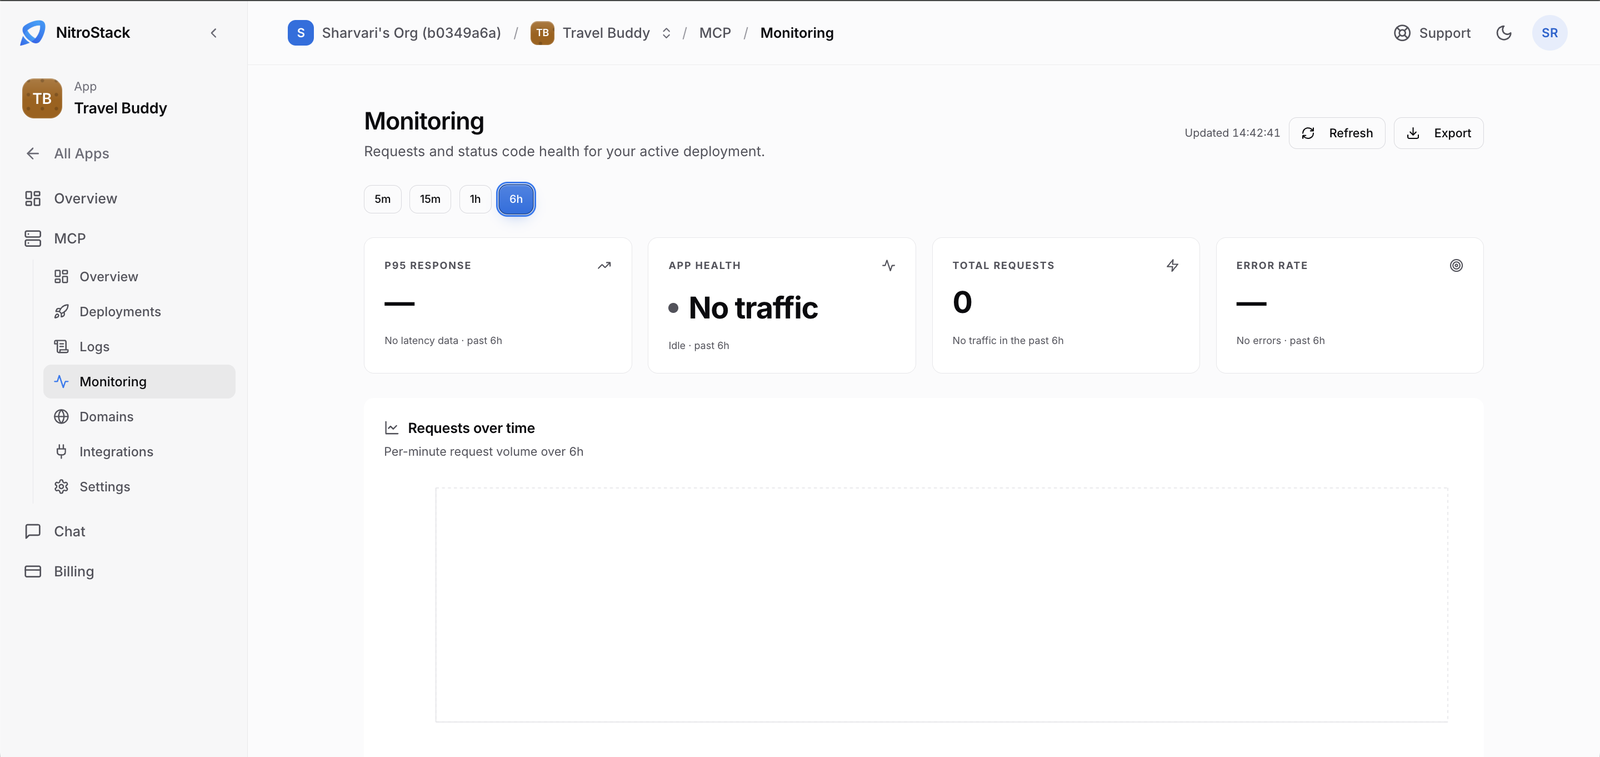
The summary cards show the 95th-percentile response time, app health, total requests, and error rate. Below them:
- Requests over time charts traffic per minute.
- Status code distribution breaks requests down by response class (2xx, 3xx, 4xx, 5xx).
- Latency charts response times.
Export downloads the data, and Refresh reloads it.