
Logs
Your server's output and every MCP message, live.
The Logs page shows everything that passes between Studio and your server as it happens: what the server prints, each MCP message in both directions, and the connection itself. When something goes wrong, this is where you see what actually happened.
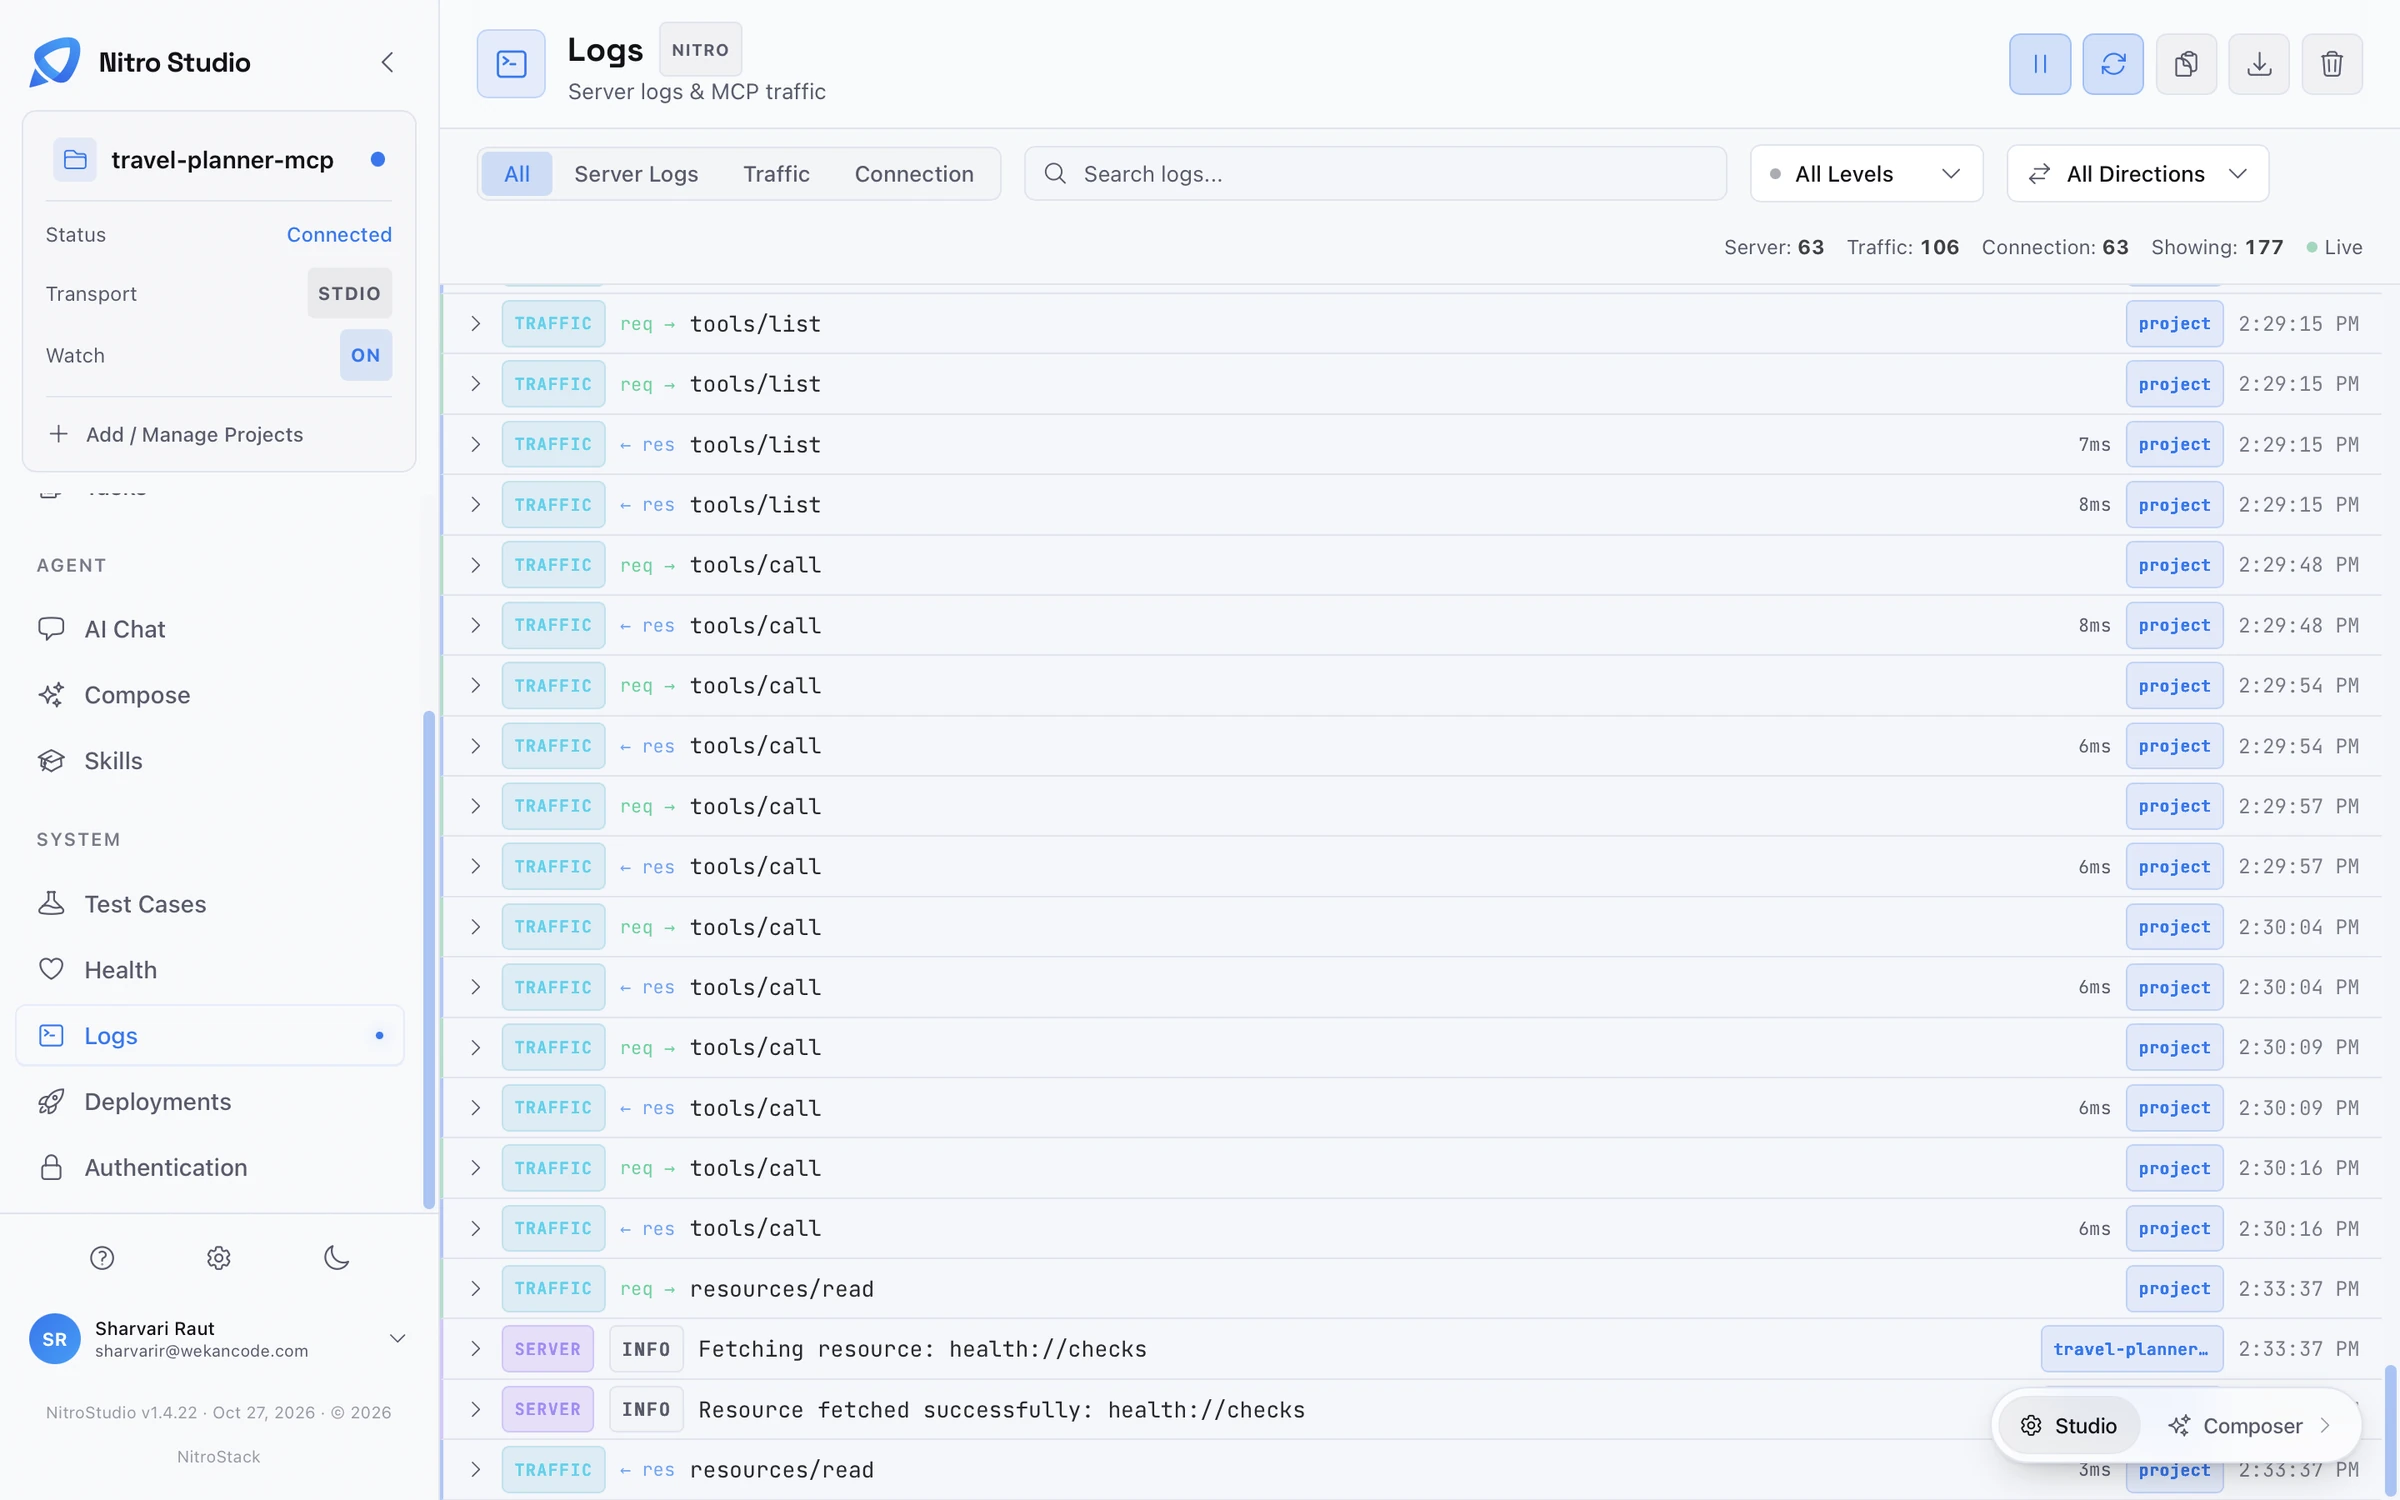
Three kinds of entry
Tabs at the top split the log.
Server Logs is what your server printed, with its level, such as INFO or ERROR. It's where you find your own log messages and stack traces.
Traffic is every MCP message. A request from Studio appears as req → tools/call; the server's answer appears as ← res tools/call, with how long it took. Opening a row shows the full message.
Connection records the connection between Studio and the server, such as when it opened or failed.
All shows the three together, in order, with counts for each at the top right.
Find what you need
Search filters every entry by text. All Levels limits server logs to a level, such as errors only, and All Directions shows only requests or only responses. The Live indicator shows that new entries are streaming in.
The buttons at the top right pause the stream, refresh it, copy the visible entries, download them to a file, and clear the log.