
Verify and debug transports
Confirm which transport a connection uses, and find out why one fails
A NitroStack server can talk to clients over STDIO, over HTTP, or over both at once (see Transports). When a client behaves unexpectedly, the first thing to establish is which transport it's actually using. Studio shows this in a few places, and the server can confirm it independently.
Check the project card
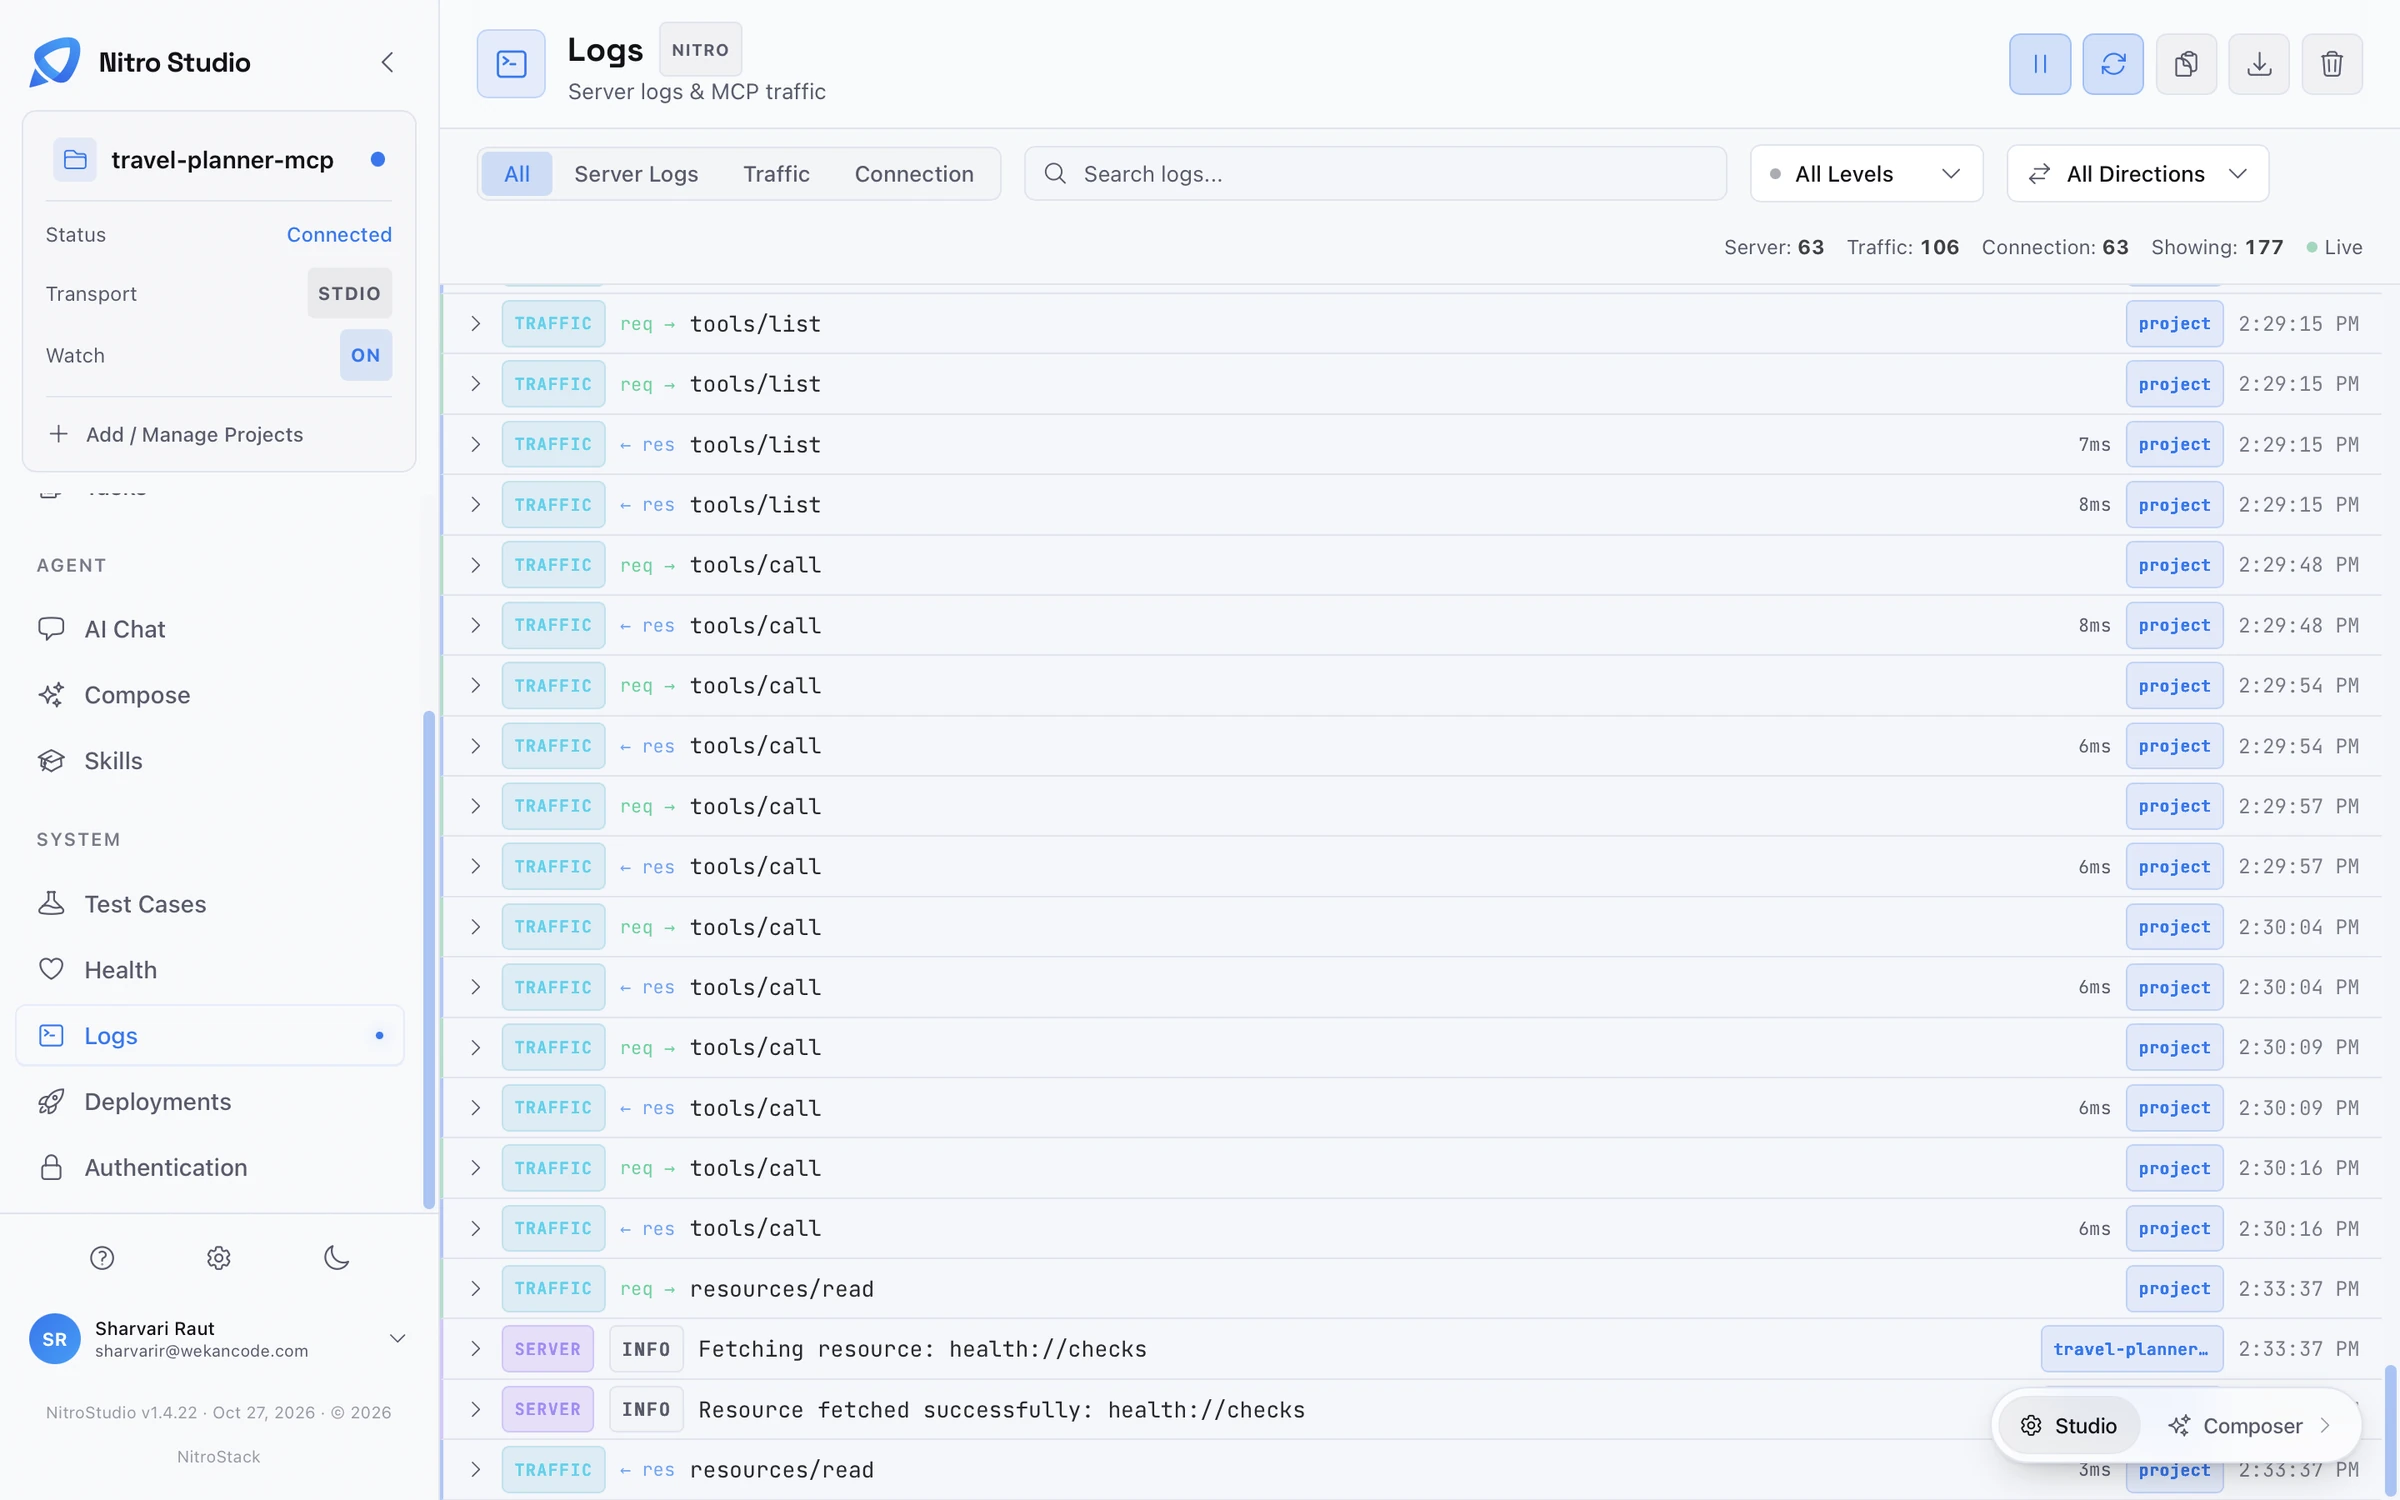
The project card at the top of NitroStudio's sidebar shows the connected project with three fields. Status says whether Studio is connected, Transport shows STDIO or HTTP, and Watch shows whether Studio reloads the server when you save a file. If Status isn't Connected, nothing else on this page applies yet; start with the troubleshooting section below.
Read the connection log
Open Logs and choose the Connection tab. It records connection events between Studio and your server, such as the connection opening, closing, or failing. When a connection drops, the last entries here are the place to start.
Watch the traffic
The Traffic tab lists every MCP message in both directions. Requests from Studio appear as req → tools/list, and replies as ← res tools/list, with the time the server took to answer. Use the direction filter to show only requests or only responses, and the search box to find one method.
If you call a tool and no tools/call request appears, the call never reached the server. If the request appears with no matching response, the server received it but failed or timed out; the Server Logs tab shows what the server printed at that moment.
Check the server directly
An HTTP server can be checked without Studio. Every NitroStack server that runs HTTP exposes a health endpoint next to its MCP endpoint:
curl http://localhost:3000/mcp/health{ "status": "ok", "transport": "streamable-http", "sessions": 0, "uptime": 12.3 }A response means the HTTP transport is up and listening on that port. Connection refused means the server isn't running over HTTP, is on a different port, or, in a container, is listening on localhost only.
npm start also prints the endpoints it serves when it starts, including Streamable HTTP at http://localhost:3000/mcp and the legacy SSE endpoint at http://localhost:3000/sse for older clients.
A server started with npm run dev runs over STDIO only, so it has no HTTP endpoint to check. Only the client that started it can talk to it.
Check the protocol version
Studio's Health page shows which MCP protocol revision the server speaks, such as 2026-07-28 Stateless, and which capabilities it advertises: tools, resources, prompts, and extensions. A server answers clients of both the current and the earlier protocol by default. Set NITRO_MCP_PROTOCOL_VERSION to 2026-07-28 or legacy to pin one; see Dual transport.
Choose the transport
The transport is decided when the server starts, in this order:
- The
transportoption passed toserver.start(). - The
MCP_TRANSPORT_TYPEenvironment variable:stdio,http, ordual. - The transport configured in
@McpApp. - Otherwise
NODE_ENV: STDIO in development or when unset, STDIO and HTTP together in production.
So npm run dev gives you STDIO, npm start gives you STDIO and HTTP, and MCP_TRANSPORT_TYPE=http npm start gives you HTTP only.
Check a Python server
For a Python project, work through these checks in order when a client can't connect, or connects but misbehaves:
- Run
nitrostack-py validateto lint the project. - Start the server with HTTP debug output:
NITROSTACK_HTTP_DEBUG=1 MCP_TRANSPORT_TYPE=http nitrostack-py dev. - Request
GET http://localhost:3000/mcp/health. - Point the MCP Inspector at
http://localhost:3000/mcp, without a trailing slash. - Keep authentication off unless OAuth is configured. Otherwise the Inspector posts to
/registerand you seeCannot POST /register. - Don't log to stdout when the server runs over STDIO, because stdout carries the protocol.
- If you rely on
X-Forwarded-HostorX-Forwarded-Proto, make sureTRUSTED_PROXIESincludes your load balancer.
See Configuration for the full list of settings.
Troubleshooting
Studio shows the project as disconnected. Check that the project builds: run npm run build in a terminal and fix any TypeScript errors it reports. A server that fails at startup, for example because a dependency can't be resolved, prints the reason in Logs, under Server Logs.
The health check works but a client can't connect. The client is probably pointed at the wrong path. The MCP endpoint is /mcp, not the server root; older SSE clients use /sse.
Requests appear in Traffic but responses take a long time. The time column shows how long the server took. Look in Server Logs for slow calls to external services, and see Performance.
Port 3000 is already in use. Another process, often a second copy of the server, holds the port. Stop it, or start this server on another port with PORT=3001 npm start.